Free Access
Fig. 8
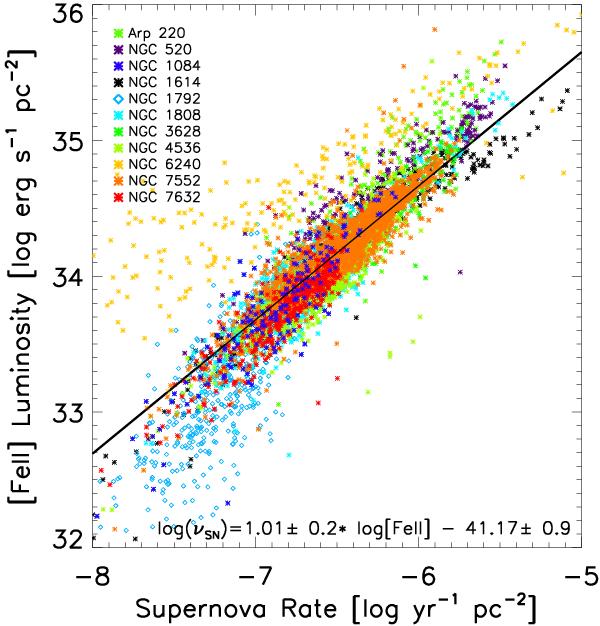
A pixel-pixel plot of SNrate, as derived from SB99, compared to [FeII] luminosity. Each galaxy is represented with a different color and the values are normalised to a square parsec. The black line represents the best fit power law excluding NGC 1792, which is represented by diamonds.
Current usage metrics show cumulative count of Article Views (full-text article views including HTML views, PDF and ePub downloads, according to the available data) and Abstracts Views on Vision4Press platform.
Data correspond to usage on the plateform after 2015. The current usage metrics is available 48-96 hours after online publication and is updated daily on week days.
Initial download of the metrics may take a while.