Fig. 7
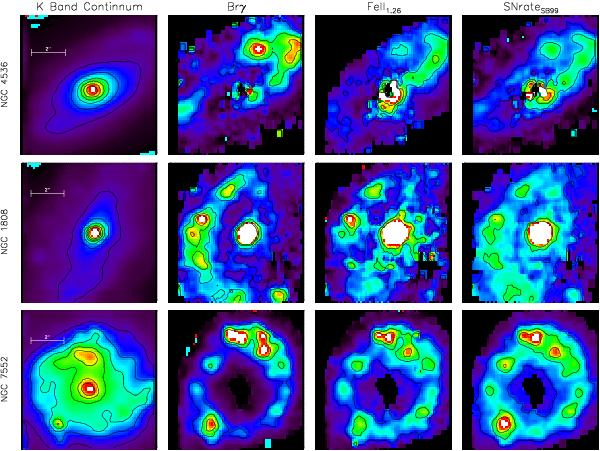
A comparison between the K-band continuum, Brγ line map, [FeII]1.26 line map, and the SNrate morphologies for NGC 4536, NGC 1808, and NGC 7552. The black discontinuities represent areas that have been filtered due to low signal-to-noise values in the line or extinction maps. The white pixels represent the highest flux regions.
Current usage metrics show cumulative count of Article Views (full-text article views including HTML views, PDF and ePub downloads, according to the available data) and Abstracts Views on Vision4Press platform.
Data correspond to usage on the plateform after 2015. The current usage metrics is available 48-96 hours after online publication and is updated daily on week days.
Initial download of the metrics may take a while.