Free Access
Fig. 5
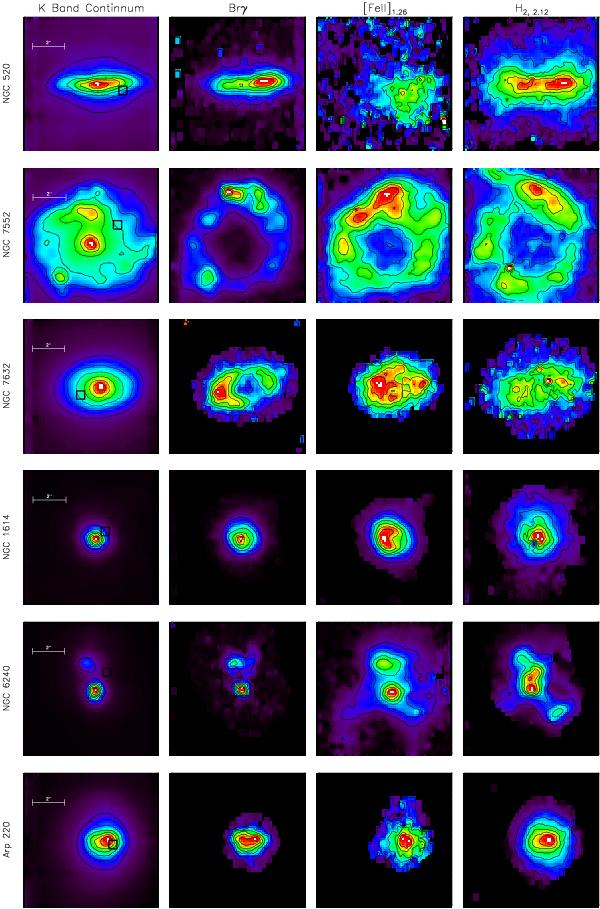
K band continuum map, Brγ, [FeII]1.26, and H2,2.12 line maps of NGC 1808, NGC 520, NGC 7552, NGC 1614, NGC 6240 and Arp 220. The pixel scale is given by the 2′′ scale bar in the K band column. The black rectangle represents the area over which the spectra in Figs. 1–3 were integrated. In all figures, north is up.
Current usage metrics show cumulative count of Article Views (full-text article views including HTML views, PDF and ePub downloads, according to the available data) and Abstracts Views on Vision4Press platform.
Data correspond to usage on the plateform after 2015. The current usage metrics is available 48-96 hours after online publication and is updated daily on week days.
Initial download of the metrics may take a while.