Fig. 1
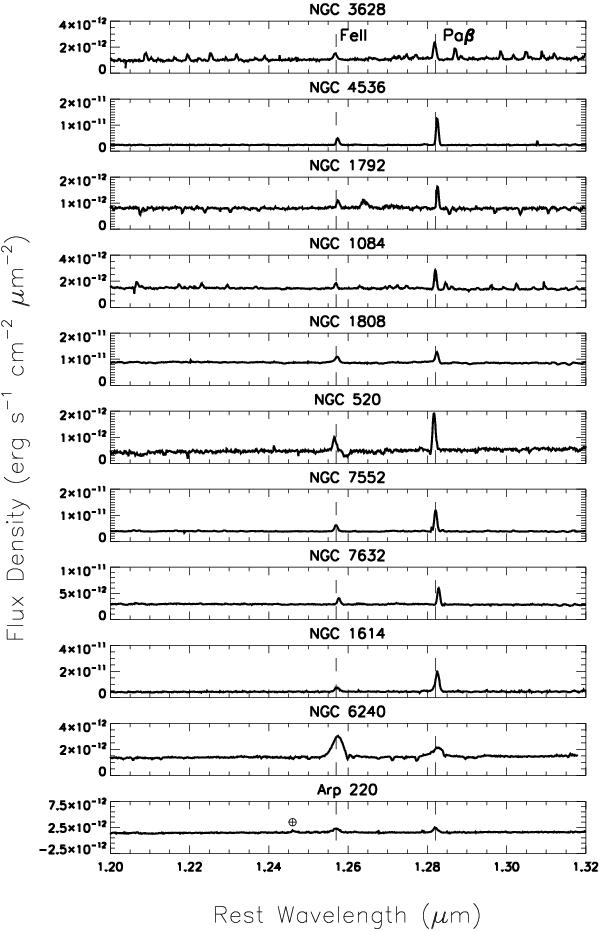
Spatially integrated rest frame spectra from the nucleus of each galaxy in the J band. The spatial area used in the integration is shown in Figs. 4 and 5 by a black rectangle. Each spectrum is integrated over an 8 × 8 pixel area. FeII1.26 and Paβ emission lines are denoted by dashed lines and marked along the top of the figure. The broad feature near 1.25 μm in the Arp 220 spectra is an atmospheric artifact along with the narrow absorption features in NGC 520, and the numerous broad peaks between 1.2–1.24 and 1.29–1.32 μm in the NGC 3628, NGC 1792 and NGC 1084 spectra.
Current usage metrics show cumulative count of Article Views (full-text article views including HTML views, PDF and ePub downloads, according to the available data) and Abstracts Views on Vision4Press platform.
Data correspond to usage on the plateform after 2015. The current usage metrics is available 48-96 hours after online publication and is updated daily on week days.
Initial download of the metrics may take a while.