Fig. 6
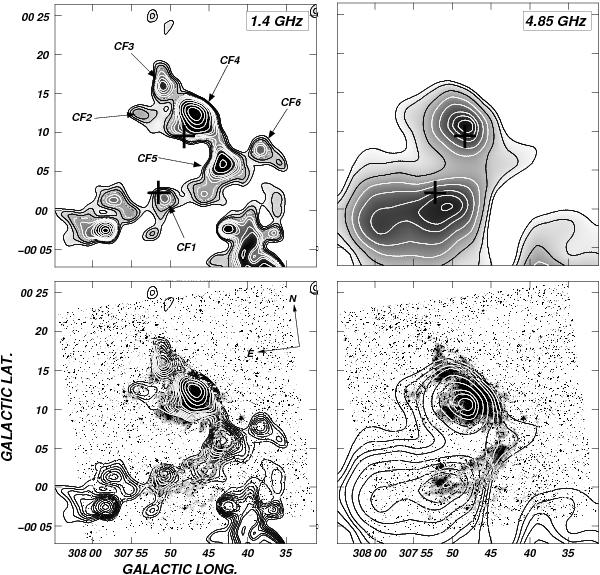
Upper panels: radio continuum emission distribution at 1.4 GHz (left panel) and 4.85 GHz (right panel). Contour levels for the 1.4 GHz image go from 21 mJy beam-1 to 42 mJy beam-1 in steps of 7 mJy beam-1 and from 60 mJy beam-1 in steps of 10 mJy beam-1. For the 4.85 GHz data the lowest contour level is 40 mJy beam-1 and the contour spacing is 20 mJy beam-1. Black crosses indicate the positions of WR 55 and HD 117797. Lower panel: overlay of the radiocontinuum emission at 1.4 GHz and 4.85 GHz on the Hα emission of RCW 78.
Current usage metrics show cumulative count of Article Views (full-text article views including HTML views, PDF and ePub downloads, according to the available data) and Abstracts Views on Vision4Press platform.
Data correspond to usage on the plateform after 2015. The current usage metrics is available 48-96 hours after online publication and is updated daily on week days.
Initial download of the metrics may take a while.