Fig. 9
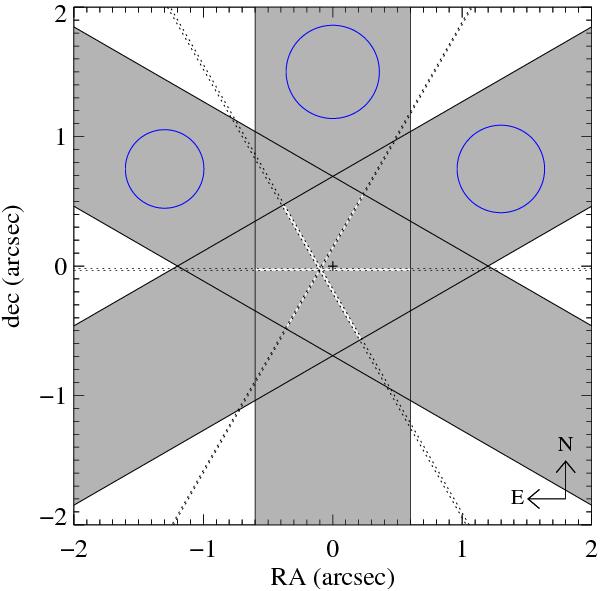
Layout of the X-shooter slits. The position of the QSO is marked by the cross. The blue circles illustrate the seeing for each observation, measured from the QSO trace at 1.6 μm. The dotted lines mark the 2σ regions for the measured impact parameter of [O iii]λ5007 for each PA. The triangulation gives an impact parameter b ≃ 0.1′′ East from the QSO.
Current usage metrics show cumulative count of Article Views (full-text article views including HTML views, PDF and ePub downloads, according to the available data) and Abstracts Views on Vision4Press platform.
Data correspond to usage on the plateform after 2015. The current usage metrics is available 48-96 hours after online publication and is updated daily on week days.
Initial download of the metrics may take a while.