Free Access
Fig. 7
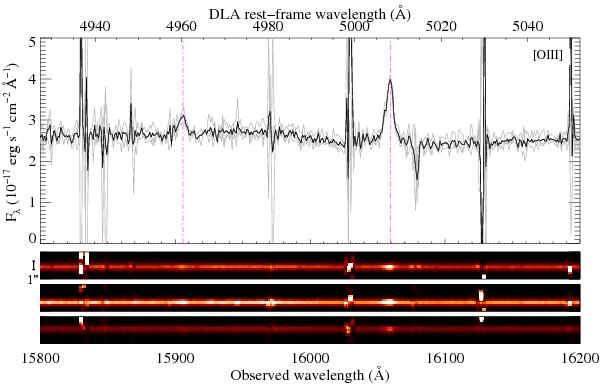
Same as Fig. 2 for the region around [O iii]λ4959 and [O iii]λ5007 (marked by dash-dotted vertical lines). Individual spectra for each PA are shown in grey.
Current usage metrics show cumulative count of Article Views (full-text article views including HTML views, PDF and ePub downloads, according to the available data) and Abstracts Views on Vision4Press platform.
Data correspond to usage on the plateform after 2015. The current usage metrics is available 48-96 hours after online publication and is updated daily on week days.
Initial download of the metrics may take a while.