Free Access
Fig. 5
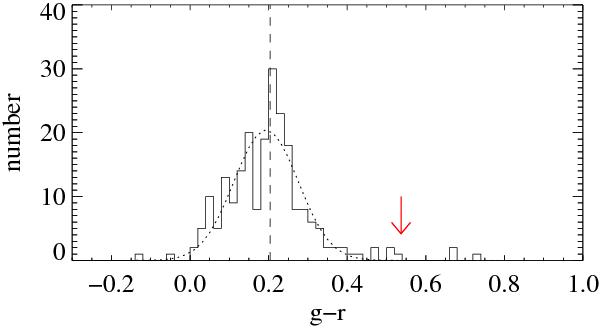
SDSS g − r colour distribution for a control sample of 222 non-BAL QSOs at redshift close to that of J1135 − 0010 and i < 19.5. The arrow indicates the location of J1135 − 0010. The vertical dashed line marks the median g − r value. The dotted line gives the best fitted Gaussian distribution.
Current usage metrics show cumulative count of Article Views (full-text article views including HTML views, PDF and ePub downloads, according to the available data) and Abstracts Views on Vision4Press platform.
Data correspond to usage on the plateform after 2015. The current usage metrics is available 48-96 hours after online publication and is updated daily on week days.
Initial download of the metrics may take a while.