Fig. 2
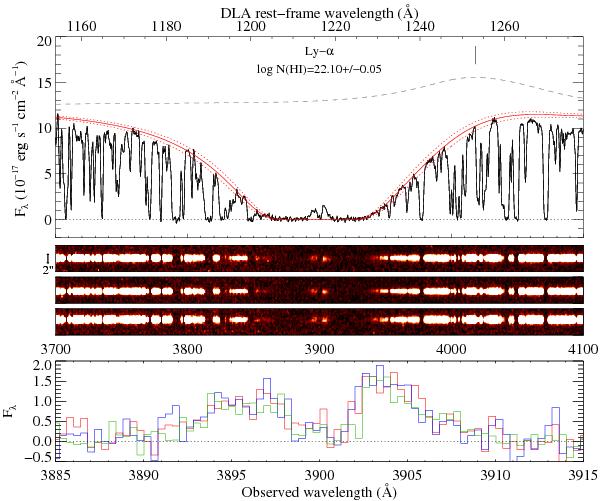
Top: one dimensional X-shooter spectrum around the DLA region (black). The best Voigt-profile fit of the DLA absorption is overplotted in red, together with the associated error (dotted red). The unabsorbed QSO continuum is represented by the dashed grey curve. Note the presence of the Ly β+O vi emission line at λ ~ 4020 Å (indicated by a short vertical line). Middle: the corresponding three 2D spectra. From top to bottom: PA = 0°, 60°, and –60°. The short vertical segment indicates the spatial scale of the y-axis. Bottom: the three 1D spectra in the region around the double-peaked Ly-α emission (green: PA = 0°; blue: PA = 60°; red: PA = –60°).
Current usage metrics show cumulative count of Article Views (full-text article views including HTML views, PDF and ePub downloads, according to the available data) and Abstracts Views on Vision4Press platform.
Data correspond to usage on the plateform after 2015. The current usage metrics is available 48-96 hours after online publication and is updated daily on week days.
Initial download of the metrics may take a while.