Fig. 17
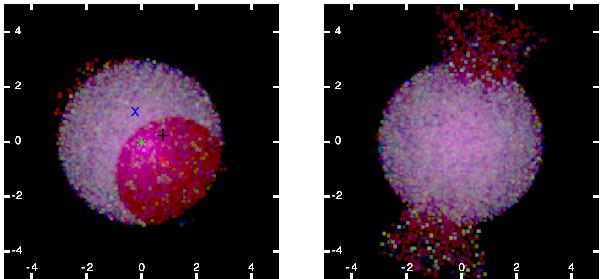
RGB SB map of the system, as viewed from our direction (left), as well as from the point of view of a fictional observer located at 90° with respect to us. Photons escaping in the wavelength regions [1210,1215.25] Å, [1215.25,1215.75] Å, and [1215.75,1222] Å are displayed in blue, green, and red, respectively. The image is centred on the centre of the galaxy (green asterisk, observationally given by the O iii emission), and the position of the QSO is marked by a black plus sign. The positions on the sky of the red and blue photons of J1135−0010 as inferred from triangulation are indicated by the red and blue crosses, respectively. The axis scale is in kpc.
Current usage metrics show cumulative count of Article Views (full-text article views including HTML views, PDF and ePub downloads, according to the available data) and Abstracts Views on Vision4Press platform.
Data correspond to usage on the plateform after 2015. The current usage metrics is available 48-96 hours after online publication and is updated daily on week days.
Initial download of the metrics may take a while.