Fig. 13
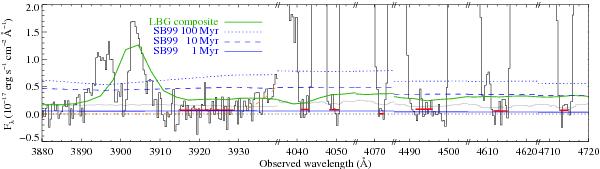
X-shooter spectrum in the bottom of saturated lines at z > zdla (black, with error spectrum in grey). The orange dashed curve raising at ~3930–3940 Å shows the bottom of synthetic Voigt profile with log N(H i) = 22.10. The green spectrum is the LBG composite spectrum from Kornei et al. (2010), scaled to match the integrated Ly α emission line. Note that the Ly α emission line is commonly diminished in the blue for LBGs, resulting in the apparent shift of the composite Ly α line towards redder wavelengths. Blue lines are synthetic stellar continua calculated with starburst99 (Leitherer et al. 1999), using a Salpeter IMF, metallicity Z = 0.004, and continuous SFR = 25 M⊙ yr-1 since respectively, 100 Myr (dotted), 10 Myr (dashed), 1 Myr (solid). Horizontal segments illustrate the mean fluxes in the corresponding regions. Note that in the case of the line at ~4495 Å, the Ly α absorption is partially blended with Si iv λ1402 from the DLA. The blended region (4497–4500 Å) is therefore not considered to compute the mean.
Current usage metrics show cumulative count of Article Views (full-text article views including HTML views, PDF and ePub downloads, according to the available data) and Abstracts Views on Vision4Press platform.
Data correspond to usage on the plateform after 2015. The current usage metrics is available 48-96 hours after online publication and is updated daily on week days.
Initial download of the metrics may take a while.