Fig. 12
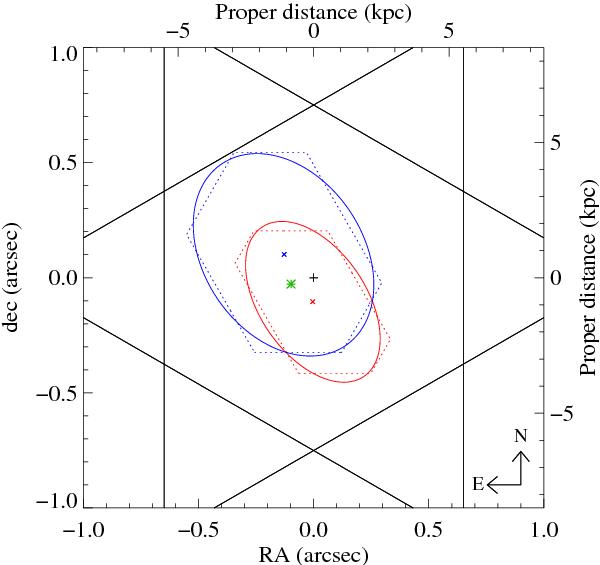
Summary of the spatial configuration. The QSO location is marked by the plus sign ( + ). The location of the [O iii] emission is marked by a green asterisk. The red and blue dotted polygons illustrate the spatial FWHM for the red and blue peaks (see Fig. 10) as shown in Fig. 11. The spatial FWHM extent of Ly α peaks is then fitted with ellipses. Triangulating the impact parameters for each PA provides the location of the centroids ( × ). Solid black lines represent the layout of the three slits. Top and right axis provide the physical projected distance in proper units at z = 2.207.
Current usage metrics show cumulative count of Article Views (full-text article views including HTML views, PDF and ePub downloads, according to the available data) and Abstracts Views on Vision4Press platform.
Data correspond to usage on the plateform after 2015. The current usage metrics is available 48-96 hours after online publication and is updated daily on week days.
Initial download of the metrics may take a while.