Fig. 11
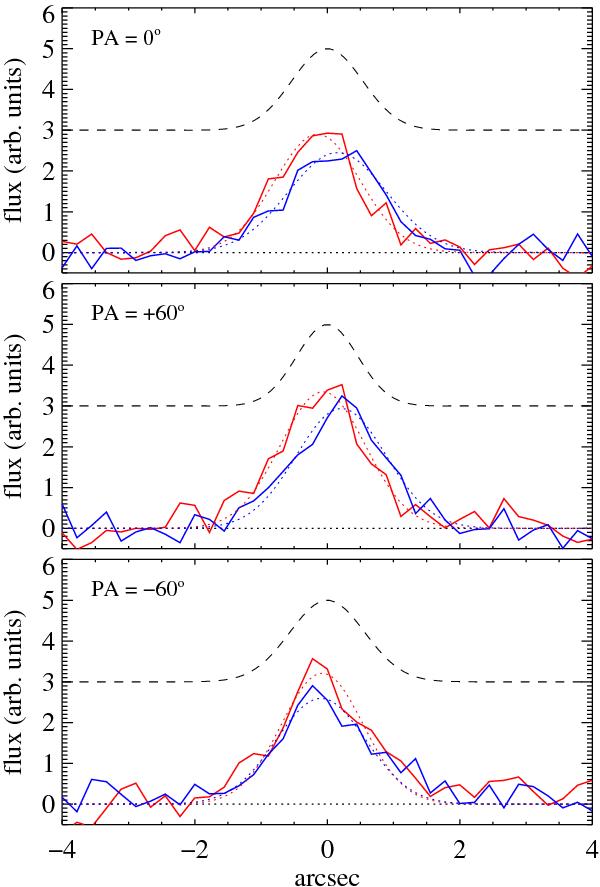
Observed spatial profiles of the Ly α emission. The red and blue profiles correspond to integrations of the emission over the velocity ranges [–500, 0] and [200, 700] km s-1 (see Fig. 10), respectively. The dotted curves are Gaussian fits to the observed profiles. The dashed profile illustrates the spectral PSF, obtained from fitting the QSO trace.
Current usage metrics show cumulative count of Article Views (full-text article views including HTML views, PDF and ePub downloads, according to the available data) and Abstracts Views on Vision4Press platform.
Data correspond to usage on the plateform after 2015. The current usage metrics is available 48-96 hours after online publication and is updated daily on week days.
Initial download of the metrics may take a while.