Fig. 10
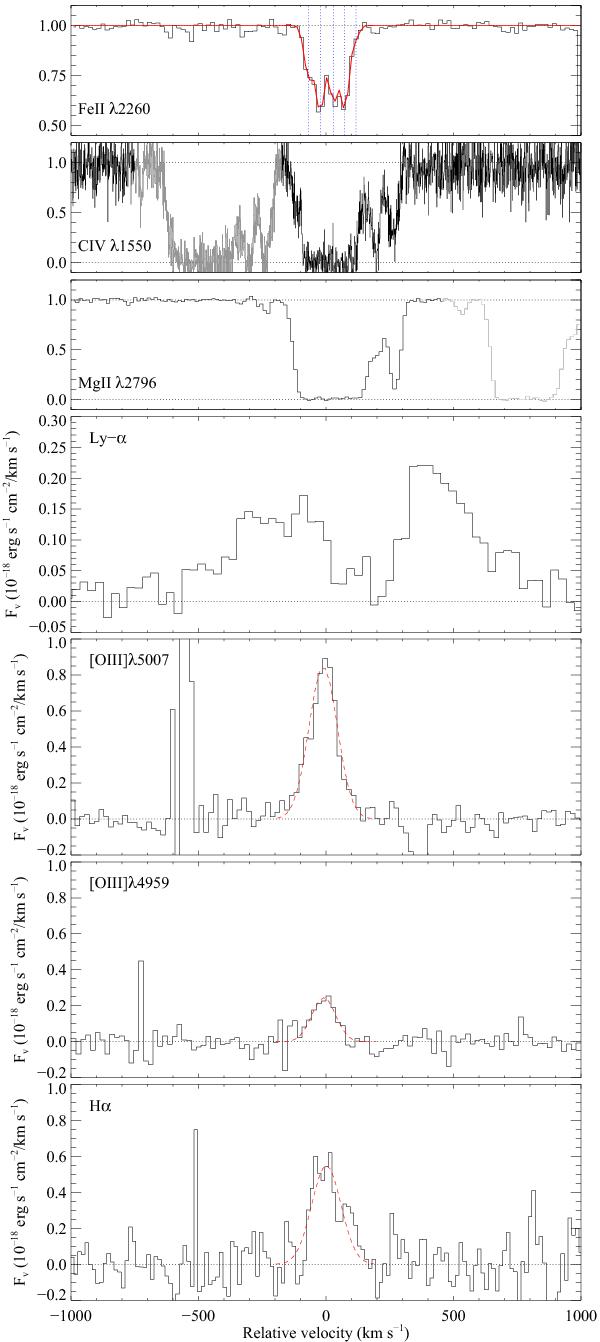
Velocity plots of absorption lines (normalised spectra, top three panels) compared to that of emission lines (continuum-subtracted spectra, bottom four panels). The quasar continuum has been subtracted to isolate the emission lines. The grey absorption features at v < −200 km s-1 (resp. v > 450 km s-1) in the C ivλ1550 panel (resp. Mg iiλ2796) are due to C ivλ1548 (resp. Mg iiλ2803). The C ivλ1550 panel shows the UVES spectrum smoothed by 4 pixels. Other panels present X-shooter data. The features at v = −550 and +350 km s-1 in the [O iii]λ5007 panel are skyline subtraction residuals.
Current usage metrics show cumulative count of Article Views (full-text article views including HTML views, PDF and ePub downloads, according to the available data) and Abstracts Views on Vision4Press platform.
Data correspond to usage on the plateform after 2015. The current usage metrics is available 48-96 hours after online publication and is updated daily on week days.
Initial download of the metrics may take a while.