Free Access
Fig. 1
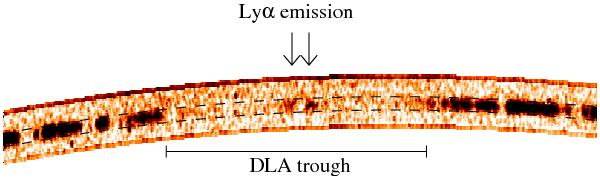
The relevant portion of the 2D MagE spectrum. The double-peaked Lyman-α emission is clearly seen in the DLA trough, where the flux of the quasar is completely absorbed. The dashed lines show the interpolated QSO trace in this region.
Current usage metrics show cumulative count of Article Views (full-text article views including HTML views, PDF and ePub downloads, according to the available data) and Abstracts Views on Vision4Press platform.
Data correspond to usage on the plateform after 2015. The current usage metrics is available 48-96 hours after online publication and is updated daily on week days.
Initial download of the metrics may take a while.