Fig. 4
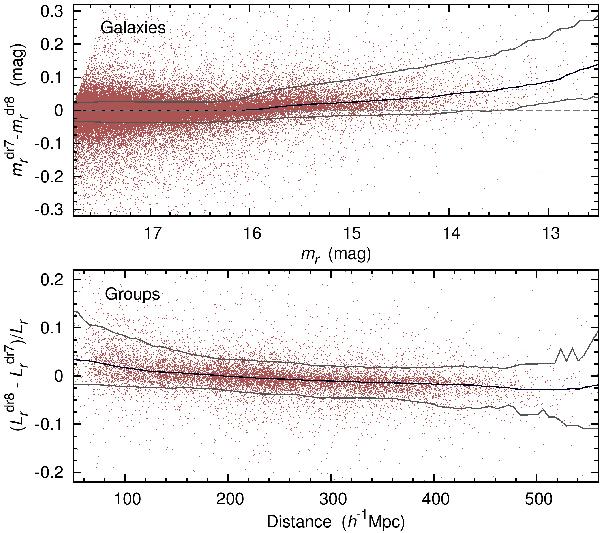
The upper panel shows the differences between the SDSS DR7 and DR8 Petrosian galaxy magnitudes as a function of galaxy luminosity. The lower panel shows the relative difference between the SDSS DR7 and DR8 group luminosities as a function of distance for groups with four and more members, which were identified as the same in the DR7 and DR8 samples. Solid lines show the 0.1, 0.5, and 0.9 quantiles, respectively.
Current usage metrics show cumulative count of Article Views (full-text article views including HTML views, PDF and ePub downloads, according to the available data) and Abstracts Views on Vision4Press platform.
Data correspond to usage on the plateform after 2015. The current usage metrics is available 48-96 hours after online publication and is updated daily on week days.
Initial download of the metrics may take a while.