Fig. 9
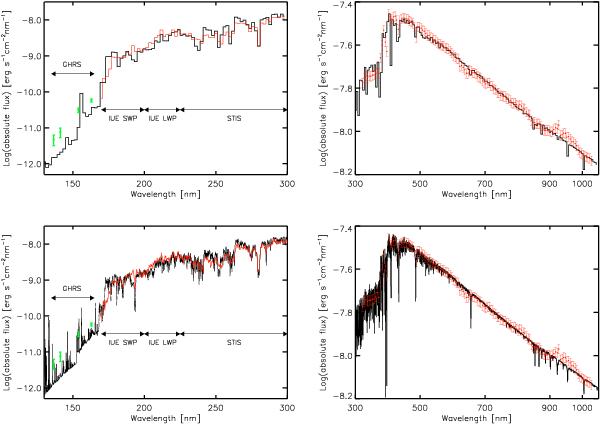
Comparisons between synthetic SED (black) and spectrophotometric measurements at ultraviolet and visual wavelengths (green dots with error bars in left column plots and red line). Top row: the models and data are binned to 2 nm resolution in the UV for clarity and to 5 nm in the visual to match the resolution of the observed spectrophotometry of Glushneva et al. (1992). Bottom row: same as above with the synthetic SED and the observations at higher spectral resolution. The synthetic SEDs are scaled in absolute flux using an angular diameter of 5.390 mas found from the fit of Vinci filter observations.
Current usage metrics show cumulative count of Article Views (full-text article views including HTML views, PDF and ePub downloads, according to the available data) and Abstracts Views on Vision4Press platform.
Data correspond to usage on the plateform after 2015. The current usage metrics is available 48-96 hours after online publication and is updated daily on week days.
Initial download of the metrics may take a while.