Free Access
Fig. 8
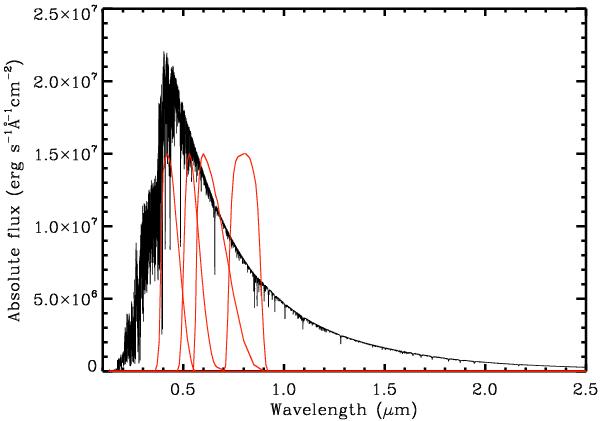
Spatially and temporally average synthetic SED from the UV to the near infrared. Red curves correspond to Bessell (1990b) for the filters BVRI.
Current usage metrics show cumulative count of Article Views (full-text article views including HTML views, PDF and ePub downloads, according to the available data) and Abstracts Views on Vision4Press platform.
Data correspond to usage on the plateform after 2015. The current usage metrics is available 48-96 hours after online publication and is updated daily on week days.
Initial download of the metrics may take a while.