Fig. 2
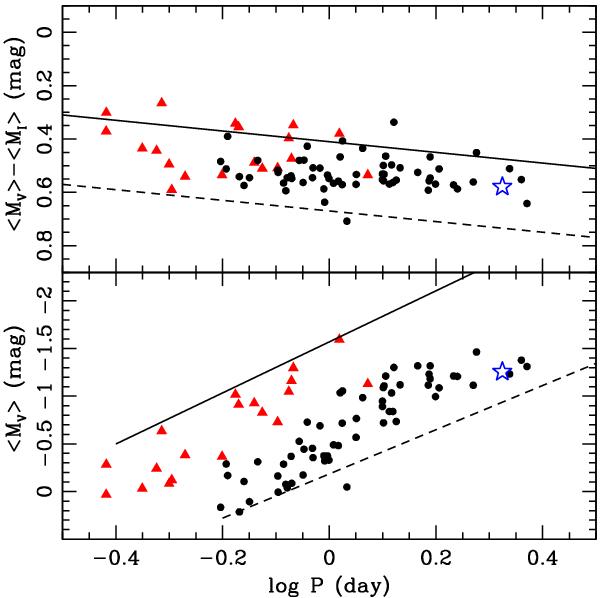
Comparison between theoretical models and OGLE-III observations. The distance modulus assumed for LMC is μ0 = 18.50 mag (Fiorentino et al. 2011), and the individual reddening values are assumed using the reddening map given by Haschke et al. (2011) (see text for details). The coding of the colours is the same as in previous figures. Top – (⟨MV⟩ − ⟨MI⟩)0 colour vs. period (log P) diagram are compared with theoretical blue (solid line) and red (dashed line) edges of the instability strip (Marconi et al. 2004); bottom – absolute magnitude (MV) vs. period (log P) plane compared with the theoretical first overtone blue (solid line) and the fundamental red (dashed line) edges of the instability strip.
Current usage metrics show cumulative count of Article Views (full-text article views including HTML views, PDF and ePub downloads, according to the available data) and Abstracts Views on Vision4Press platform.
Data correspond to usage on the plateform after 2015. The current usage metrics is available 48-96 hours after online publication and is updated daily on week days.
Initial download of the metrics may take a while.