Fig. 9
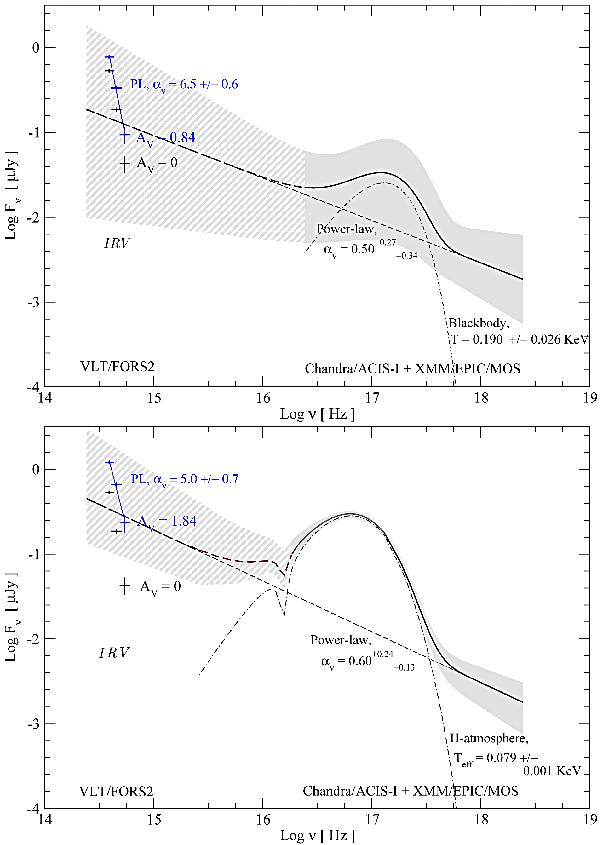
Multi-wavelength unabsorbed spectra for PSR J1357−6429, assuming the BB+PL (top panel) and NSA+PL (bottom panel) spectral models for the explanation of its X-ray spectrum. The best fits to the X-ray spectrum, including thermal (BB or NSA) and non-thermal (PL) components, are shown by different lines. The fits are extrapolated to the optical range. The hatched regions are the fit and extrapolation uncertainties. They are larger for the BB+PL model than for the NSA+PL model, because the NS radius to the distance ratio is fixed for the latter case, which decreases the formal uncertainties in the fit. The observed and dereddened optical fluxes are shown by the black and blue cross-bars, respectively, and the blue lines are the best power law fits to the dereddened optical SEDs. The respective extinction values AV, spectral indices αν, and NS temperatures T, are shown in both plots.
Current usage metrics show cumulative count of Article Views (full-text article views including HTML views, PDF and ePub downloads, according to the available data) and Abstracts Views on Vision4Press platform.
Data correspond to usage on the plateform after 2015. The current usage metrics is available 48-96 hours after online publication and is updated daily on week days.
Initial download of the metrics may take a while.