Fig. 4
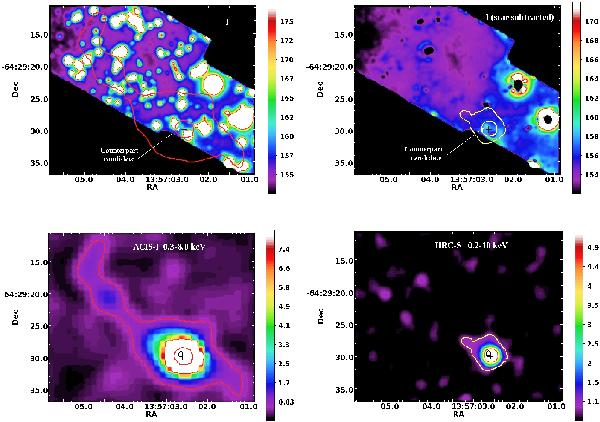
Comparison of the fragment of the optical I-band image of the PSR J1327−6429 field (top panels) with the corresponding fragments of the X-ray images obtained with Chandra ACIS-I and HRC-S (bottom panels). The fragments sizes, ~47′′ × 53′′, are selected to show a tail-like structure of the PWN extended NE of the pulsar and best resolved in the ACIS-I image (bottom-left panel). Only the brightest inner part of this structure is resolved in the HRC-S image of a shorter exposure (bottom-right panel). The ACIS-I image is corrected by the exposure map, binned by two pixels, and smoothed with the three pixel Gaussian kernel. The HRC image is binned by four pixels and smoothed with the same kernel. Background stars are subtracted in the right optical panel. The optical images are smoothed with the three pixel kernel as well, that reflects the seeing value. The cross and its arms mark the X-ray position of the pulsar and its 1σ uncertainties obtained from the HRC image. The contours from the ACIS (red) and HRC (yellow) X-ray images of the pulsar/PWN system are overlaid on the optical left and right images, respectively. Internal contours show the FWHM of the ACIS and HRC PSFs, while the outer ones indicate the PWN boundaries where this nebula merges with the background. The small black circle in the X-ray images shows the position and FWHM of the PSF of the faint pulsar optical counterpart candidate marked by an arrow. The candidate position is compatible with the X-ray pulsar position at the 1σ significance level, while no extended PWN counterpart is visible in the optical. Colour bars show the image values, which are in 1000 counts units for the optical and in single counts for X-rays.


Current usage metrics show cumulative count of Article Views (full-text article views including HTML views, PDF and ePub downloads, according to the available data) and Abstracts Views on Vision4Press platform.
Data correspond to usage on the plateform after 2015. The current usage metrics is available 48-96 hours after online publication and is updated daily on week days.
Initial download of the metrics may take a while.