Fig. 9
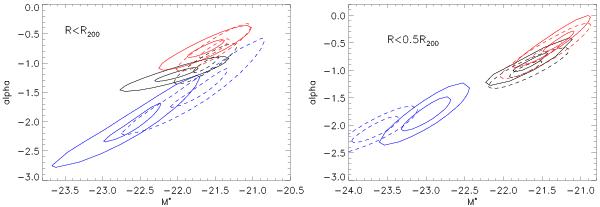
Error contours at the 1 and 3σ c.l. for the best-fitting LF parameters considering the galaxy population within R < R200 (left panel) and R < 0.5R200 (right panel). Black, red and blue lines show the composite LF for the whole galaxy sample, red and blue galaxies, respectively. Solid lines indicate DARC clusters and dashed lines indicate relaxed clusters.
Current usage metrics show cumulative count of Article Views (full-text article views including HTML views, PDF and ePub downloads, according to the available data) and Abstracts Views on Vision4Press platform.
Data correspond to usage on the plateform after 2015. The current usage metrics is available 48-96 hours after online publication and is updated daily on week days.
Initial download of the metrics may take a while.