Fig. 4
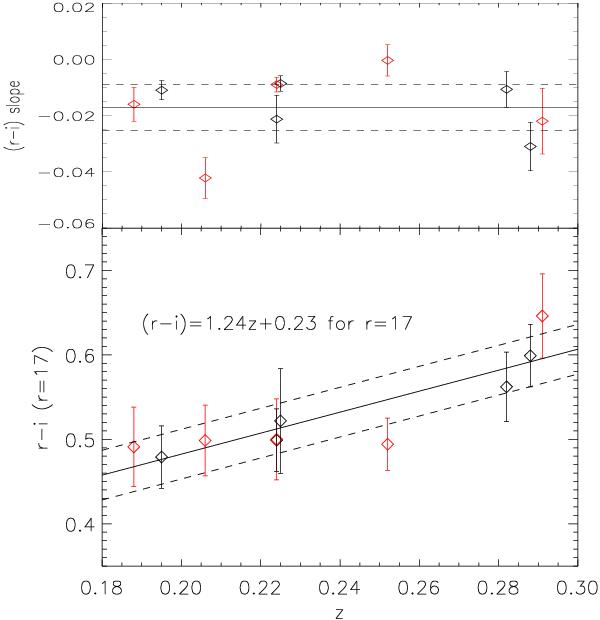
RS parameters vs. redshift: the (r′ − i′) vs. r′ slope (upper panel) and (r′ − i′) color at r′ = 17 (lower panel). Black symbols indicate DARC clusters and red symbols indicate relaxed clusters. The solid line in the upper panel shows the mean value for all ten clusters. The solid line in the lower panel shows the linear fit. The dashed lines show one-sigma uncertainties of the linear fit.
Current usage metrics show cumulative count of Article Views (full-text article views including HTML views, PDF and ePub downloads, according to the available data) and Abstracts Views on Vision4Press platform.
Data correspond to usage on the plateform after 2015. The current usage metrics is available 48-96 hours after online publication and is updated daily on week days.
Initial download of the metrics may take a while.