Free Access
Fig. 2
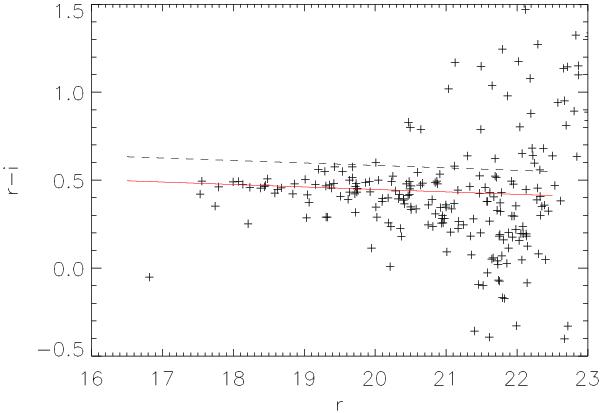
Color–magnitude diagram r′ − i′ vs. r′ considering galaxies within 0.5  Mpcfrom the center of Abell 383. The RS (red solid line) is fitted using galaxies with r′ < 20.2. Galaxies with r′ − i′ > RS+0.15 (on the dashed line) are considered background galaxies and were rejected from the analysis.
Current usage metrics show cumulative count of Article Views (full-text article views including HTML views, PDF and ePub downloads, according to the available data) and Abstracts Views on Vision4Press platform.
Data correspond to usage on the plateform after 2015. The current usage metrics is available 48-96 hours after online publication and is updated daily on week days.
Initial download of the metrics may take a while.