Fig. 5
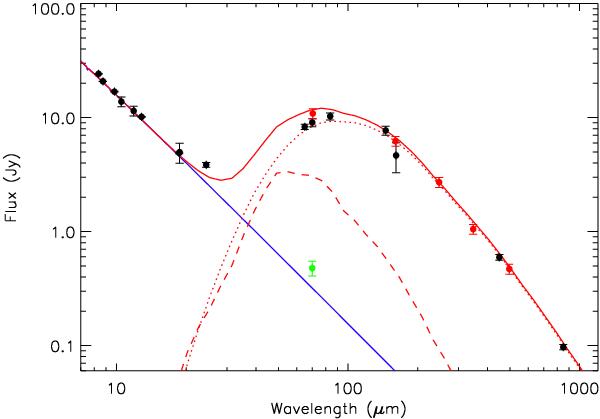
The infrared SED of the Fomalhaut system. Black dots are photometric measurements from the literature, red dots the Herschel photometry. The full red line represents the best model, the dotted and dashed red lines indicate the contribution of the large grains and blow-out grains respectively. The blue line is the stellar photosphere model. The green dot indicates the total flux of the central point source in the 70 μm image, and shows the excess of the stellar photosphere. The excess-to-stellar luminosity ratio, estimated from the model, is 7.4 × 10⁻⁵, of which 27% is produced by blow-out grains.
Current usage metrics show cumulative count of Article Views (full-text article views including HTML views, PDF and ePub downloads, according to the available data) and Abstracts Views on Vision4Press platform.
Data correspond to usage on the plateform after 2015. The current usage metrics is available 48-96 hours after online publication and is updated daily on week days.
Initial download of the metrics may take a while.