Fig. 6
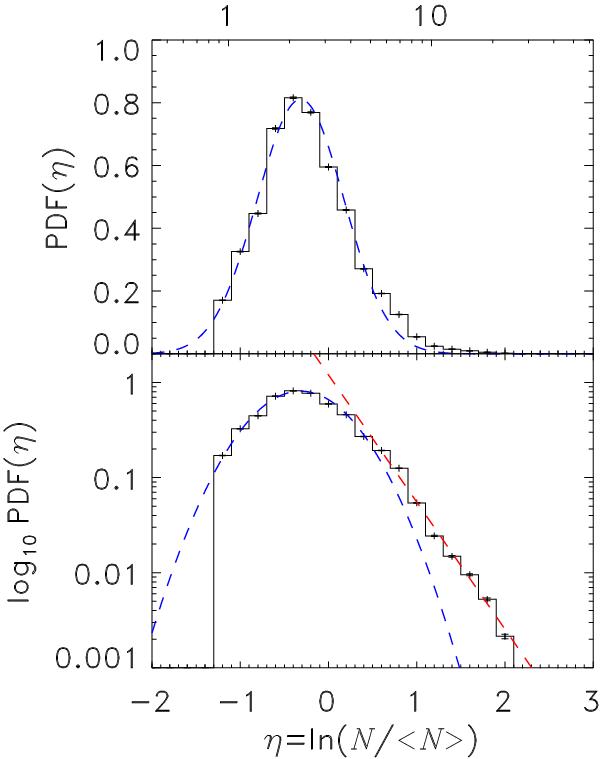
Probability density function of the whole cloud obtained from the column density map in linear (top) and logarithmic (bottom) scaling. The upper labeling indicates the visual extinction. The red dashed line shows a power-law fit (the high-density range beyond AV = 20m is not well resolved, we therefore did not attempt to fit a second power law.)
Current usage metrics show cumulative count of Article Views (full-text article views including HTML views, PDF and ePub downloads, according to the available data) and Abstracts Views on Vision4Press platform.
Data correspond to usage on the plateform after 2015. The current usage metrics is available 48-96 hours after online publication and is updated daily on week days.
Initial download of the metrics may take a while.