Fig. 5
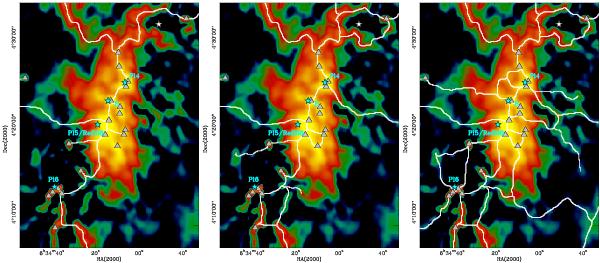
Close-up of the curvelet image (Fig. 1) of the center region of the Rosette molecular cloud with the filamentary structure traced by DisPerSE, indicated with white lines. Different thresholds (called “persistence”, i.e. intensity contrast level, for filament detection were used (2.9, 1.0, 0.5 × 1021 cm-2 from left to right). The curvelet image has a maximum value for the column density of 2 × 1022 cm-2 with a sigma of 0.5 × 10²¹ and the original column density map a maximum of 9.4 × 1022 cm-2 with a sigma of 1.4 × 10²¹.
Current usage metrics show cumulative count of Article Views (full-text article views including HTML views, PDF and ePub downloads, according to the available data) and Abstracts Views on Vision4Press platform.
Data correspond to usage on the plateform after 2015. The current usage metrics is available 48-96 hours after online publication and is updated daily on week days.
Initial download of the metrics may take a while.