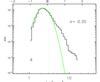
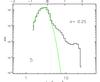
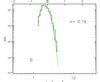
Fig. 3
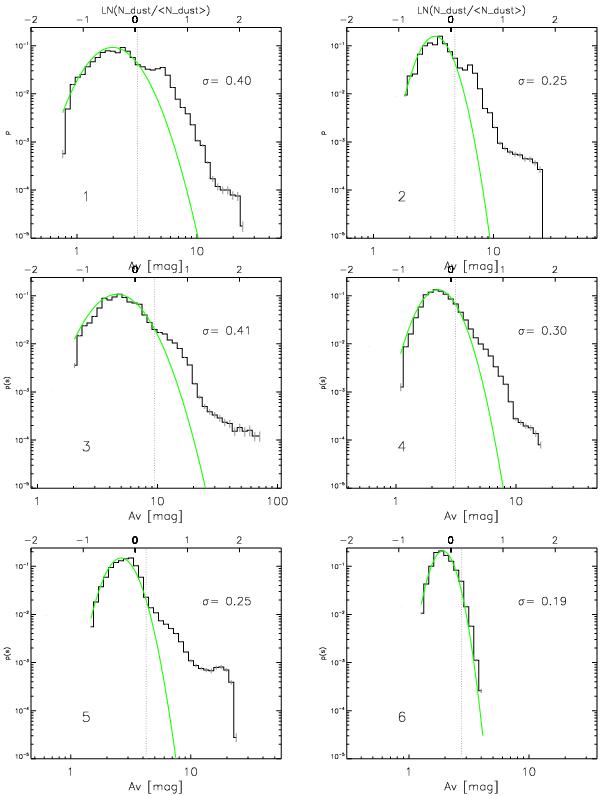
PDFs for the six subregions in the Rosette, labeled from 1 to 6. The green line indicates the fitted PDF. The AV -value of the deviation of the PDF from the log-normal form is shown as a dotted vertical line and the width of the PDF (ση) is given in each panel.
This figure is made of several images, please see below:
Current usage metrics show cumulative count of Article Views (full-text article views including HTML views, PDF and ePub downloads, according to the available data) and Abstracts Views on Vision4Press platform.
Data correspond to usage on the plateform after 2015. The current usage metrics is available 48-96 hours after online publication and is updated daily on week days.
Initial download of the metrics may take a while.