Fig. 1

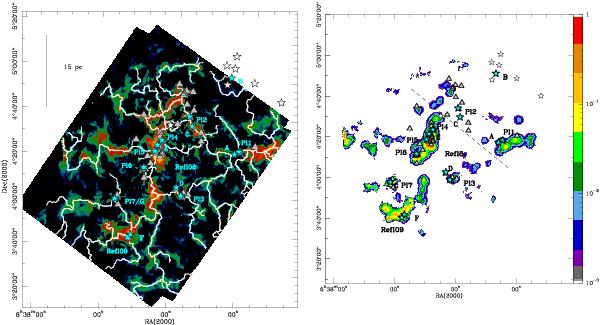
Left: curvelet map of the column density, expressed in logarithmic magnitudes of visual extinction (AV = 0.05 to 7). The absolute values, however, depend on the decomposition threshold ( ≈ 20% of the intensity are in the curvelets) and are not relevant for this study. The filamentary structure becomes apparent and is additionally traced by DisPerSE (white lines). See Appendix B for more details and a close-up of the central region. Known infrared-clusters are indicated as blue stars (“Pl” for Phelps & Lada 1997, A–F for Poulton et al. 2008, and Refl for Román-Zúñiga et al. 2008). White stars in the upper right corner indicate the O-stars from NGC 2244. Gray triangles are the massive dense cores (MDCs) identified in Motte et al. (2010). Right: a map showing the “confidence” (coded from 0 to 1 in color scale) of finding cluster formation sites. This map combines the information of the column density map and the locations of filament junctions (see text for details). Known clusters and MDCs are labeled as in the left panel. The dashed line indicates the approximate border beyond which (toward the cluster) SF due to the direct compression scenario may be at work.
Current usage metrics show cumulative count of Article Views (full-text article views including HTML views, PDF and ePub downloads, according to the available data) and Abstracts Views on Vision4Press platform.
Data correspond to usage on the plateform after 2015. The current usage metrics is available 48-96 hours after online publication and is updated daily on week days.
Initial download of the metrics may take a while.


