Free Access
Fig. 6
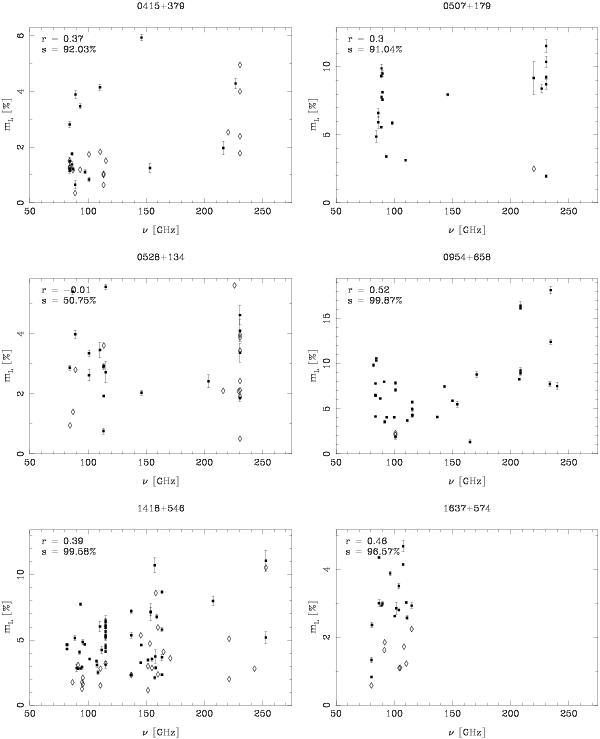
Degree of linear polarization mL as function of observing frequency ν. Squares with errorbars denote polarization measurements; diamonds indicate 3σ upper limits. Please note the different mL axis scales. Errorbars denote 1σ errors. We quote correlation coefficients r and significance levels s like in Fig. 3.
Current usage metrics show cumulative count of Article Views (full-text article views including HTML views, PDF and ePub downloads, according to the available data) and Abstracts Views on Vision4Press platform.
Data correspond to usage on the plateform after 2015. The current usage metrics is available 48-96 hours after online publication and is updated daily on week days.
Initial download of the metrics may take a while.