Fig. 3
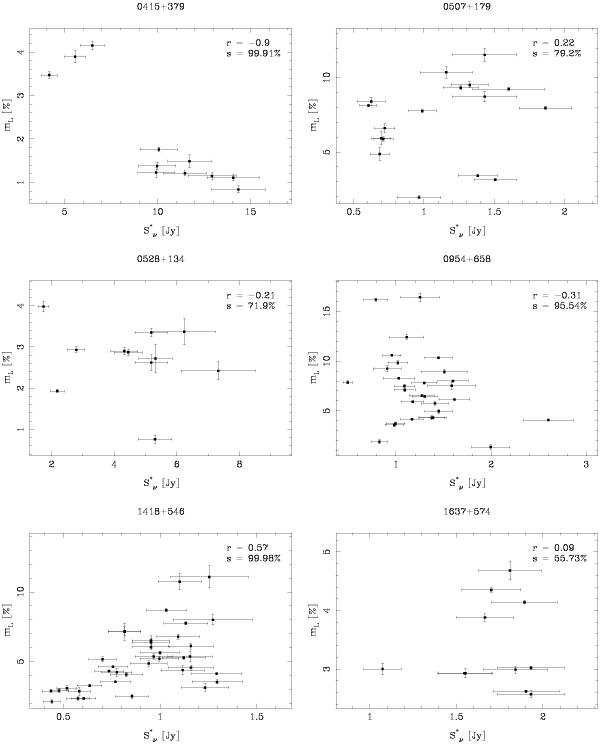
Degree of linear polarization mL as function of rescaled flux density  . Please note the different axis scales. Errorbars denote 1σ errors. In each
  diagram we give the Pearson correlation coefficient r. We also quote (in units of %) for each value of r the significance s = 1 − p with p being the false-alarm probability for the null hypothesis “the true value of r is zero”.
Current usage metrics show cumulative count of Article Views (full-text article views including HTML views, PDF and ePub downloads, according to the available data) and Abstracts Views on Vision4Press platform.
Data correspond to usage on the plateform after 2015. The current usage metrics is available 48-96 hours after online publication and is updated daily on week days.
Initial download of the metrics may take a while.