Fig. 1
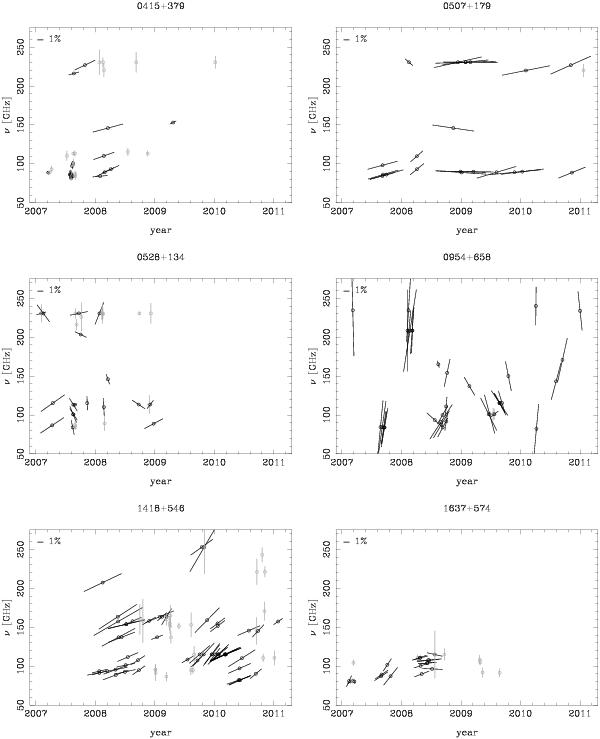
Linear polarization state as function of time t and observation frequency ν. We give the result of each polarization measurement via a black bar in the t − ν plane. The length of each bar corresponds to the degree of linear polarization according to the scales in the upper left corners of the corresponding panels (in units of %). The orientation of the bar indicates the polarization angle; angles are counted counter-clockwise from the 12-o’clock position. Points in the t − ν plane where a measurement was carried out but no polarization was detected are indicated by gray bars. The length of each gray bar corresponds to a 3σ upper limit on the polarization level. As upper limits do not have meaningful polarization angles, all gray bars are fixed at the 12-o’clock position.
Current usage metrics show cumulative count of Article Views (full-text article views including HTML views, PDF and ePub downloads, according to the available data) and Abstracts Views on Vision4Press platform.
Data correspond to usage on the plateform after 2015. The current usage metrics is available 48-96 hours after online publication and is updated daily on week days.
Initial download of the metrics may take a while.