Fig. 1
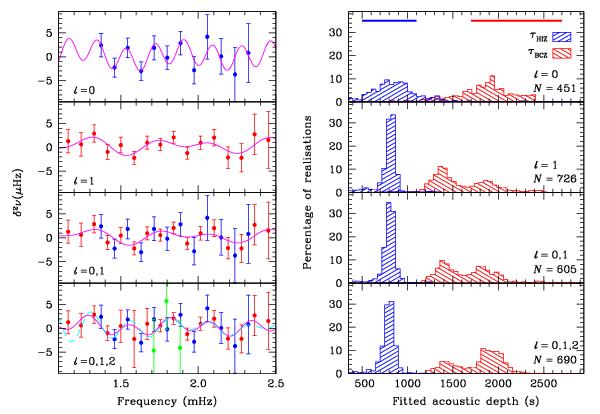
Fits of Eq. (1) to the second differences of the mean CoRoT frequencies for HD 49933 and the histograms for the fitted values of τHIZ and τBCZ for different realisations of the data for different subsets (corresponding to different choices of ℓ values). The second differences of the frequencies of ℓ = 0 (blue), ℓ = 1 (red) and ℓ = 2 (green) modes of HD 49933 and their fit to Eq. (1) (magenta curve) are shown in the left panel. The dotted cyan line in the bottom left panel shows the fit by the Houdek & Gough (2007) form. The corresponding histograms of the fitted values of τBCZ (in red) and τHIZ (in blue) for different realisations are shown in the right panel. N denotes the total number of valid realisations after rejecting fits with τBCZ > 2700 s. The solid bands at the top of the right panel indicate the range of initial guesses for the two parameters in each fit.
Current usage metrics show cumulative count of Article Views (full-text article views including HTML views, PDF and ePub downloads, according to the available data) and Abstracts Views on Vision4Press platform.
Data correspond to usage on the plateform after 2015. The current usage metrics is available 48-96 hours after online publication and is updated daily on week days.
Initial download of the metrics may take a while.