Fig. 2
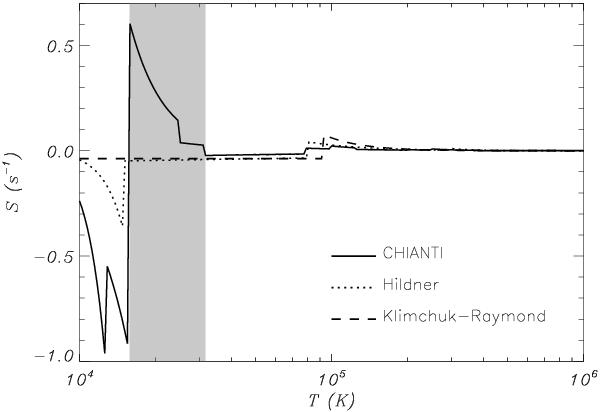
Approximate thermal mode growth rate vs. temperature in the absence of thermal conduction and for Hildner’s (dotted), Klimchuk-Raymond’s (dashed), and CHIANTI-based (solid) loss functions. The shaded area denotes the region of instability at low temperatures obtained with the CHIANTI-based loss function that is not present for the other parametrizations.
Current usage metrics show cumulative count of Article Views (full-text article views including HTML views, PDF and ePub downloads, according to the available data) and Abstracts Views on Vision4Press platform.
Data correspond to usage on the plateform after 2015. The current usage metrics is available 48-96 hours after online publication and is updated daily on week days.
Initial download of the metrics may take a while.