Fig. 4
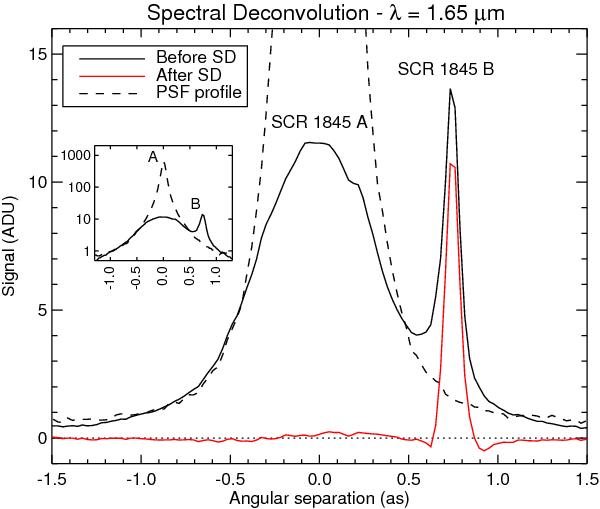
Comparison of cuts along the spatial dimension of the spectra before (plain, black) and after (plain, red) SD at λ = 1.65 μm. Since the star was kept outside the slit to prevent saturation, the profile of the primary before SD does not show the true peak of the primary PSF, but instead the level of the halo brightness with the slit decentered by ~0.2′′. The PSF profile from the star obtained from Fig. 1 is overplotted (dashed, black) to give an estimation of the true contrast (4.17 mag in H-band) between the companion and the primary. For clarity, the main plot has been cut at 16 ADU, but the sub-plot shows the full profiles on a log scale with the same units in x and y.
Current usage metrics show cumulative count of Article Views (full-text article views including HTML views, PDF and ePub downloads, according to the available data) and Abstracts Views on Vision4Press platform.
Data correspond to usage on the plateform after 2015. The current usage metrics is available 48-96 hours after online publication and is updated daily on week days.
Initial download of the metrics may take a while.