Fig. 9
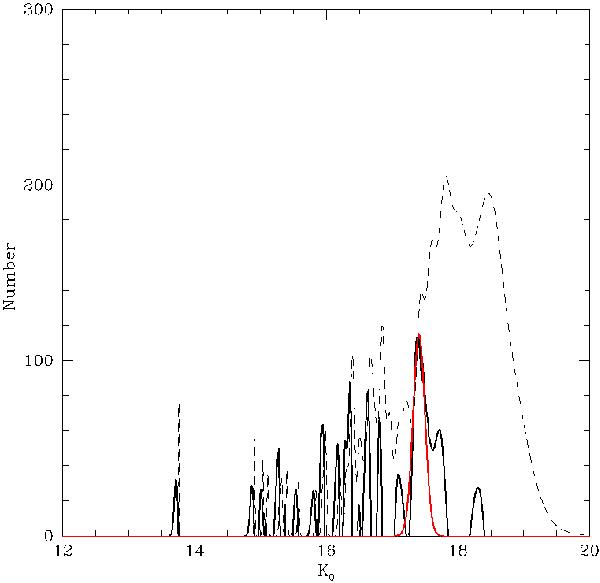
A smoothed K-band magnitude distribution (dashed line) for region of size 17′ × 17′. The Sobel filter (solid black line) has been applied and a Gaussian curve (solid red line) has been fitted to the strongest peak to locate the TRGB magnitude and error. The TRGB lies at K0 = 17.41 ± 0.11 mag. The distribution is a generalised histogram and the vertical scale is arbitrary.
Current usage metrics show cumulative count of Article Views (full-text article views including HTML views, PDF and ePub downloads, according to the available data) and Abstracts Views on Vision4Press platform.
Data correspond to usage on the plateform after 2015. The current usage metrics is available 48-96 hours after online publication and is updated daily on week days.
Initial download of the metrics may take a while.