Fig. 5
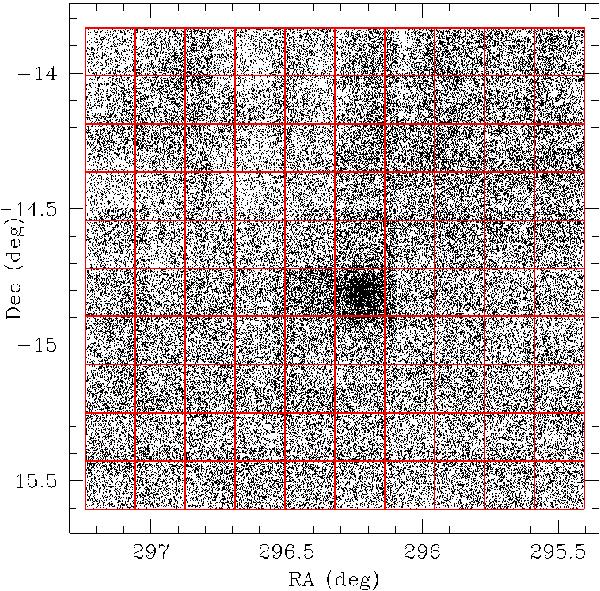
The division of the observed area into a grid of 100 regions, each of dimensions 10′ × 10′, prior to foreground removal. The sources shown have been defined as stellar or probably-stellar in all three photometric bands, no other selection criteria have been applied. Some of the patchiness seen here is the result of varying limiting magnitudes in the observations – particularly in the NE footprint.
Current usage metrics show cumulative count of Article Views (full-text article views including HTML views, PDF and ePub downloads, according to the available data) and Abstracts Views on Vision4Press platform.
Data correspond to usage on the plateform after 2015. The current usage metrics is available 48-96 hours after online publication and is updated daily on week days.
Initial download of the metrics may take a while.