Free Access
Fig. 28
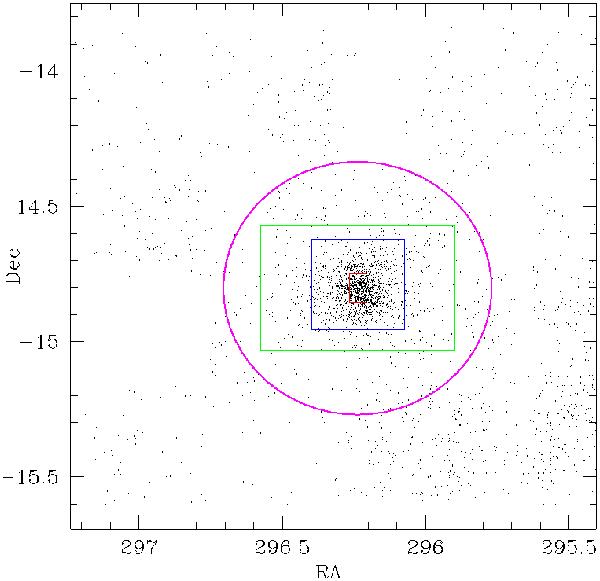
The relative areas observed by ourselves (whole area) and the observations of Kang et al. (2006) (red rectangle), Cioni & Habing (2005) (blue) and Letarte et al. (2002) (green). The outer circle represents the central 4 kpc, the sources contained in Catalogue 1.
Current usage metrics show cumulative count of Article Views (full-text article views including HTML views, PDF and ePub downloads, according to the available data) and Abstracts Views on Vision4Press platform.
Data correspond to usage on the plateform after 2015. The current usage metrics is available 48-96 hours after online publication and is updated daily on week days.
Initial download of the metrics may take a while.