Fig. 27
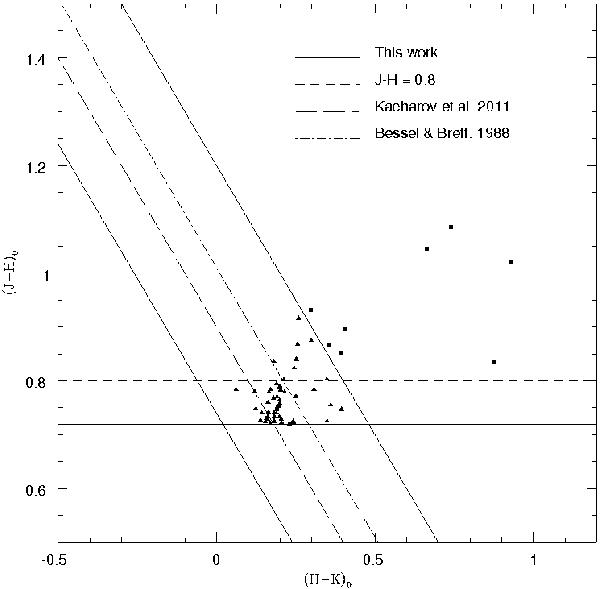
Colour–colour diagram showing the possible contaminant sources with K0 < 14.75 mag discussed in the Sect. 3.1. C- and M-type sources are shown as squares and triangles respectively. The solid diagonal lines show the colour selection criteria applied during this study (J − K)0 = 0.74 and 1.20 mag. The horizontal line at (J − H)0 = 0.72 mag shows the position of the foreground colour boundary. The long-dash diagonal line represents the blue J − K boundary of Kacharov et al. (2012) and the dash-dot line the blue-limit of (Bessell & Brett 1988), Sect. 5.3.2. The short-dash horizontal line represents the alternative (J − H)0 = 0.80 mag colour criterion considered in Sect. 5.3.1.
Current usage metrics show cumulative count of Article Views (full-text article views including HTML views, PDF and ePub downloads, according to the available data) and Abstracts Views on Vision4Press platform.
Data correspond to usage on the plateform after 2015. The current usage metrics is available 48-96 hours after online publication and is updated daily on week days.
Initial download of the metrics may take a while.