Fig. 23
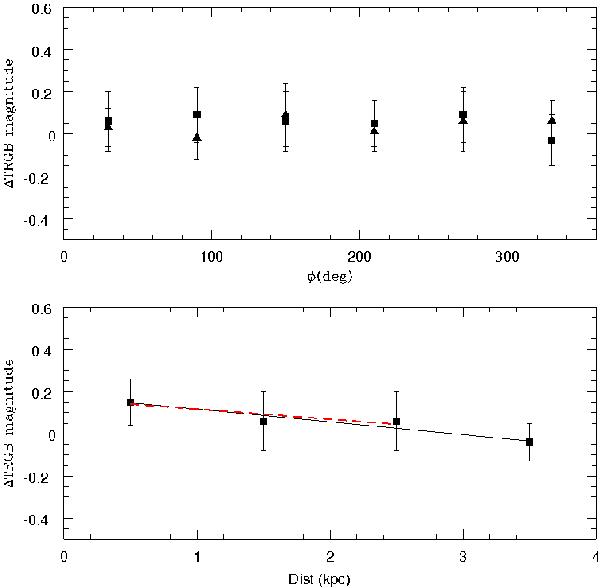
Top: distribution of TRGB magnitudes for each region of the inner (squares) and outer (triangles) annuli (Fig. 18) plotted against azimuthal angle. Bottom: TRGB magnitude measured in each of the 4 equally spaced annuli described previously plotted as a function of distance from the galactic centre. A weighted linear fit has been made to all the data points (solid black line) and to only those points within 3 kpc of the centre (dashed red line).
Current usage metrics show cumulative count of Article Views (full-text article views including HTML views, PDF and ePub downloads, according to the available data) and Abstracts Views on Vision4Press platform.
Data correspond to usage on the plateform after 2015. The current usage metrics is available 48-96 hours after online publication and is updated daily on week days.
Initial download of the metrics may take a while.