Fig. 16
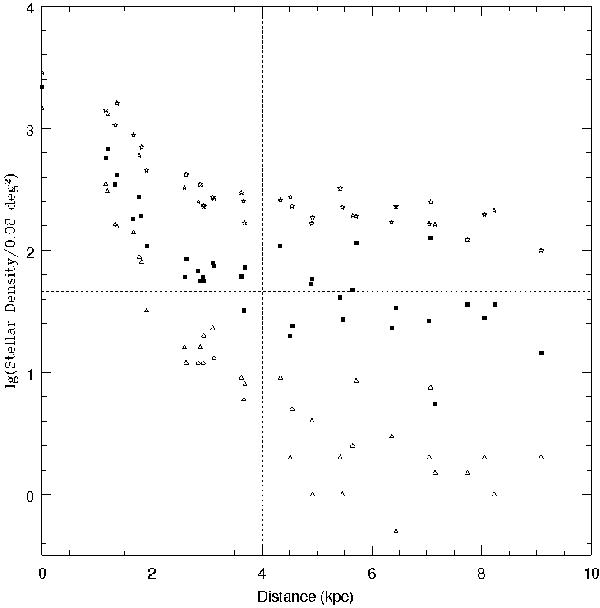
Stellar density profiles of the C-type (triangles) and M-type (squares) AGB and RGB (stars) sources in each region in the multi-resolution grid (Fig. 15). The stellar density has been normalised to account for the varying area of each grid region. The horizontal lines at 1.66 and 0.48 represent the level of the remaining foreground contamination in the M- and C-type samples respectively. The vertical line at 4 kpc marks the limit of the detectable stellar component of NGC 6822.
Current usage metrics show cumulative count of Article Views (full-text article views including HTML views, PDF and ePub downloads, according to the available data) and Abstracts Views on Vision4Press platform.
Data correspond to usage on the plateform after 2015. The current usage metrics is available 48-96 hours after online publication and is updated daily on week days.
Initial download of the metrics may take a while.