Free Access
Fig. 12
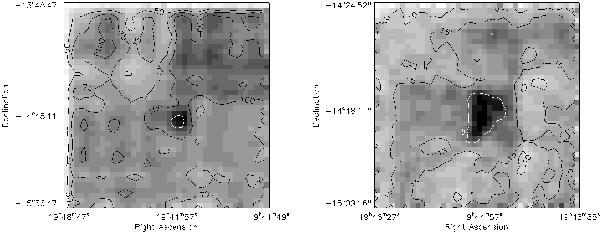
Density distribution of foreground sources removed from the data set as described in the text. On the left using 1600 bins across the full observed area contours are at 50, 75, 100 and 150. On the right is the high resolution plot, contours are at 10, 15 and 25.
This figure is made of several images, please see below:
Current usage metrics show cumulative count of Article Views (full-text article views including HTML views, PDF and ePub downloads, according to the available data) and Abstracts Views on Vision4Press platform.
Data correspond to usage on the plateform after 2015. The current usage metrics is available 48-96 hours after online publication and is updated daily on week days.
Initial download of the metrics may take a while.