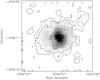
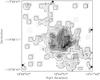
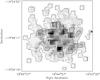
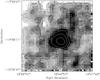
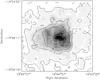
Fig. 11
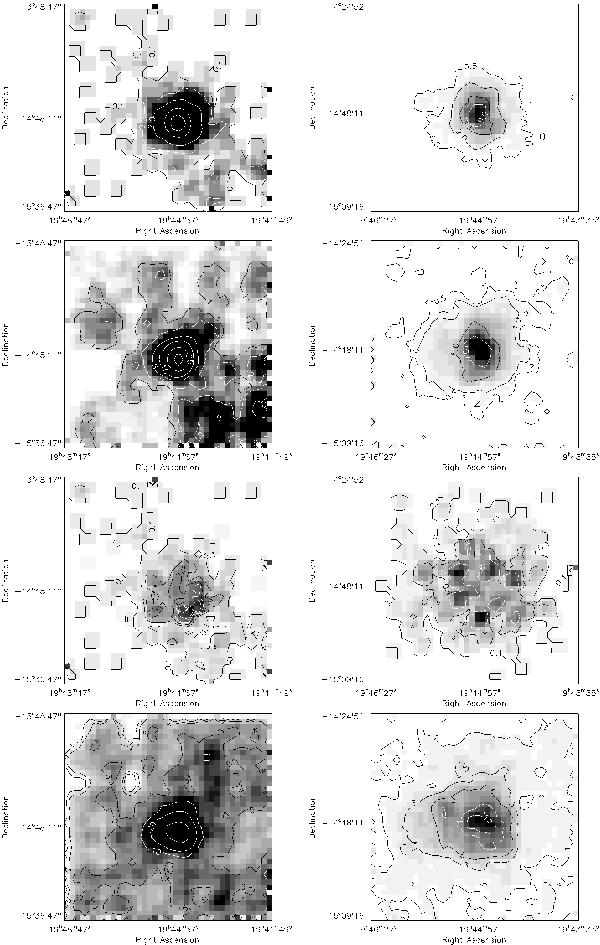
From top to bottom, density distribution of: carbon-rich stars, oxygen-rich stars, the C/M ratio and RGB stars. Each row shows, on the left a map of the full observed area using 1600 bins and on the right a map of the central 34′ × 34′ also using 1600 bins. Contours are at: 0.1, 0.5, 2, 10 and 15 for carbon-rich stars in low resolution map and 0.5, 2, 5 and 8 in the high resolution map. For oxygen-rich stars contours are at: 1, 2, 5, 10, 25 and 50 in the low resolution map and 0.5, 1, 5 and 10 in the high resolution map. For the C/M ratio the contours are at: 0.1, 0.4, 0.6, 0.8 and 1 in the low resolution and 0.1, 0.4 and 0.8 in the high resolution map. For the RGB stars contours are at: 1, 2, 5, 10, 20 and 50 in the low resolution map and at 1, 3, 6, 11 and 15 in the high resolution map. At a distance of 490 kpc, the full field is 14.5 × 14.5 kpc2, whilst the high resolution field is 4.85 × 4.85 kpc2.
Current usage metrics show cumulative count of Article Views (full-text article views including HTML views, PDF and ePub downloads, according to the available data) and Abstracts Views on Vision4Press platform.
Data correspond to usage on the plateform after 2015. The current usage metrics is available 48-96 hours after online publication and is updated daily on week days.
Initial download of the metrics may take a while.