Fig. 14
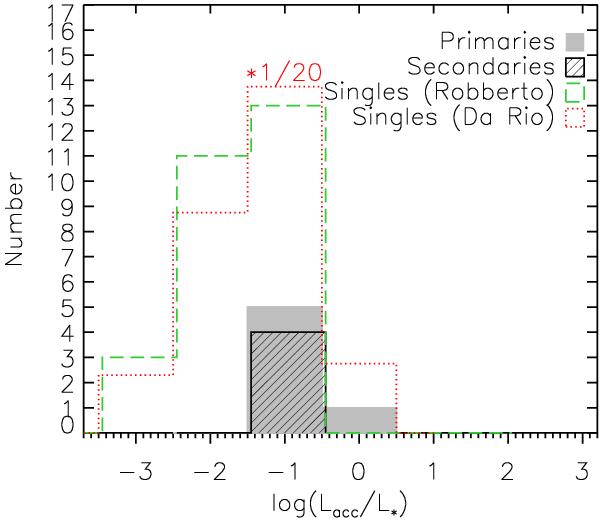
Histogram of the accretion luminosities of the primaries (gray shaded area) and secondaries (hatched) calculated from the Brγ emission. For comparison, the accretion luminosity distributions of single stars of Orion from Robberto et al. (2004, dashed outline) and Da Rio et al. (2010, dotted outline, scaled by a factor of 1/20 for clear comparability) are overplotted, both limited to the same range of stellar masses as in our binary survey. The distributions are slightly offset relative to each other to make them more visible.
Current usage metrics show cumulative count of Article Views (full-text article views including HTML views, PDF and ePub downloads, according to the available data) and Abstracts Views on Vision4Press platform.
Data correspond to usage on the plateform after 2015. The current usage metrics is available 48-96 hours after online publication and is updated daily on week days.
Initial download of the metrics may take a while.