Fig. 9
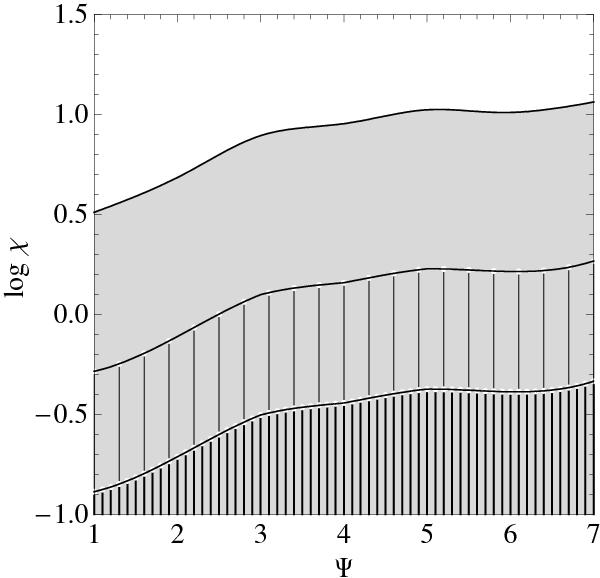
Two-dimensional parameter space, given by central rotation strength χ vs. concentration Ψ, of differentially rotating models defined by  ; the remaining parameters are fixed at
  . The upper solid line marks the maximum admitted values of χ, for given values of concentration Ψ, that is the underlying area indicates pairs (Ψ,χ) for which models can be constructed. The intermediate and the lower solid lines mark the values of
  , respectively. The gray, wide-striped, and thin-striped areas represent the extreme, rapid, and moderate rotation regimes, respectively.
Current usage metrics show cumulative count of Article Views (full-text article views including HTML views, PDF and ePub downloads, according to the available data) and Abstracts Views on Vision4Press platform.
Data correspond to usage on the plateform after 2015. The current usage metrics is available 48-96 hours after online publication and is updated daily on week days.
Initial download of the metrics may take a while.