Fig. 26
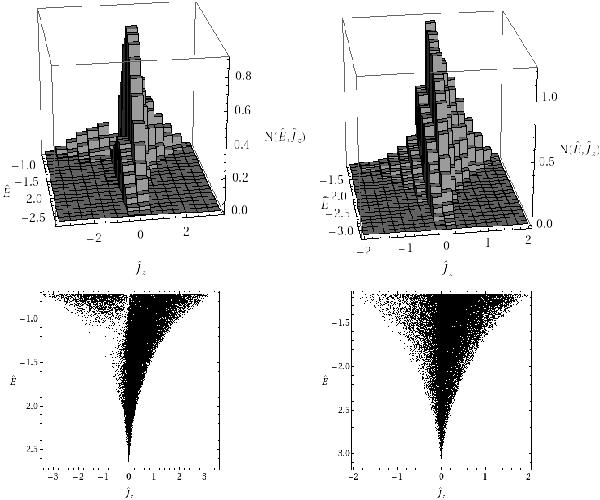
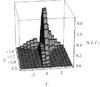
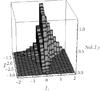
Top panels: histogram (scaled to unity) of the phase space density N(Ê,Ĵz) for a differentially rotating model characterized by Wilson truncation (left) with  , and for one characterized by plain truncation (right) with
  . Both models are characterized by
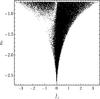
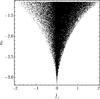
  . Bottom panels: Lindblad diagrams for the same models presented in the top panels. The graphs have been obtained by a Monte Carlo sampling of the relevant distribution functions with 65 536 particles.
Current usage metrics show cumulative count of Article Views (full-text article views including HTML views, PDF and ePub downloads, according to the available data) and Abstracts Views on Vision4Press platform.
Data correspond to usage on the plateform after 2015. The current usage metrics is available 48-96 hours after online publication and is updated daily on week days.
Initial download of the metrics may take a while.