Fig. 20
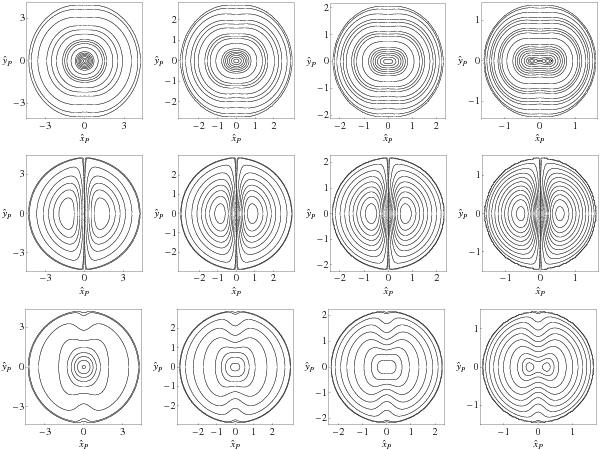
Contour maps of the surface density, mean line-of-sight velocity, and line-of-sight velocity dispersion (from top row to bottom row) of the differentially rotating models with Ψ = 2,  , and χ = 0.04,0.16,0.36,1.00 (from left to right, as in Fig. 13), projected along the
  -axis of the intrinsic coordinate system (“edge-on” view, so that
  and ŷP correspond to the ŷ and ẑ axes of the intrinsic system, respectively). In the panels in the first row, solid lines represent the isophotes corresponding to selected values of Σ/Σ0 in the range [1.02,10-7] ; only the last (fastest rotating) model shows values Σ/Σ0 > 1, when the toroidal structure appears. Panels in the second row illustrate the contours of the dimensionless rotation velocity in the range [0.5,10-5] at intervals of 0.05 (from left to right, the values of the innermost contours are 0.25,0.35,0.4,0.45, respectively). Panels in the last row show the contours of the projected velocity dispersion in the range [0.4,10-5] at intervals of 0.05 (the values of the innermost contours are 0.3 for the first three models and 0.4 for the last one).


Current usage metrics show cumulative count of Article Views (full-text article views including HTML views, PDF and ePub downloads, according to the available data) and Abstracts Views on Vision4Press platform.
Data correspond to usage on the plateform after 2015. The current usage metrics is available 48-96 hours after online publication and is updated daily on week days.
Initial download of the metrics may take a while.