Fig. 17
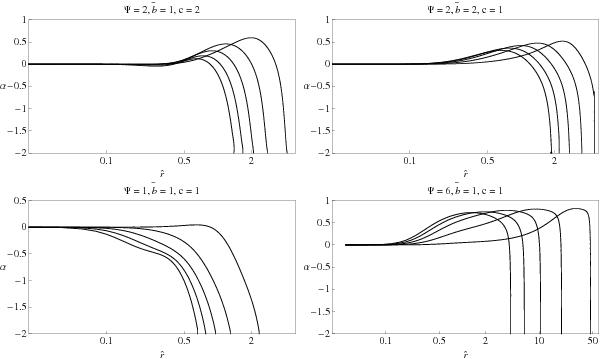
Radial profiles of the anisotropy parameter for selected sequences of differentially rotating models, evaluated on the equatorial plane. Top panels: the sequences are characterized by Ψ = 2, χ = 0.04,0.16,0.36,0.64,1.00 (in each panel, from right to left); the left and right panels show the effect of increasing of parameters c and  , respectively. Bottom panels: the sequences are characterized by
  , χ = 0.04,0.16,0.36,0.64,1.00 (in each panel, from right to left); the left and right panels show the effect of decreasing and increasing the concentration parameter Ψ, respectively.
Current usage metrics show cumulative count of Article Views (full-text article views including HTML views, PDF and ePub downloads, according to the available data) and Abstracts Views on Vision4Press platform.
Data correspond to usage on the plateform after 2015. The current usage metrics is available 48-96 hours after online publication and is updated daily on week days.
Initial download of the metrics may take a while.