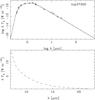
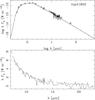
Fig. A.1
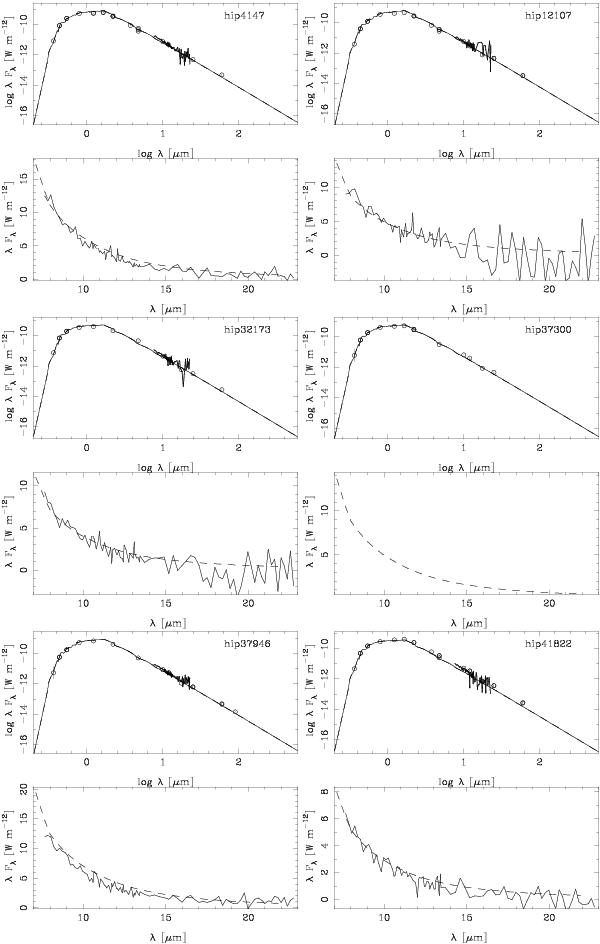
Fits to the SED (top panel) and IRAS LRS spectra (lower panel). In the top panel, the solid line indicates the best fit, the dashed line the model without mass loss (in many cases the two models overlap and are indistinguishable). The observed photometry is inidicated by the circles, and error bars are also plotted, but typically are much smaller than the symbol size. In the lower panel, the best-fit model is indicated by the dashed line, and the LRS spectrum by the solid line. Sometimes no LRS spectrum was available.
Current usage metrics show cumulative count of Article Views (full-text article views including HTML views, PDF and ePub downloads, according to the available data) and Abstracts Views on Vision4Press platform.
Data correspond to usage on the plateform after 2015. The current usage metrics is available 48-96 hours after online publication and is updated daily on week days.
Initial download of the metrics may take a while.