Free Access
Fig. 8
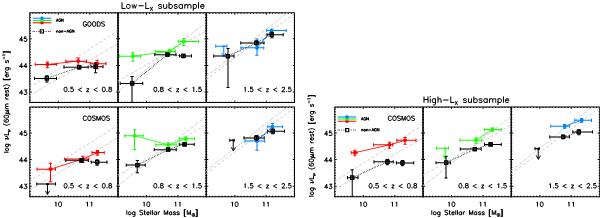
Same as Fig. 5, for low luminosity AGNs (see text) on the left and high luminosity AGNs on the right. The inactive galaxies are slightly changed, since they are randomly extracted from the total control sample to be mass-matched to the corresponding AGN subsample.
Current usage metrics show cumulative count of Article Views (full-text article views including HTML views, PDF and ePub downloads, according to the available data) and Abstracts Views on Vision4Press platform.
Data correspond to usage on the plateform after 2015. The current usage metrics is available 48-96 hours after online publication and is updated daily on week days.
Initial download of the metrics may take a while.